Introduction
The Reportana General Dashboard offers a centralized view of your entire company’s operation, gathering strategic data on sales, customer service, automations, campaigns, and channel performance.
In this tutorial, you will learn how to navigate the dashboard, interpret key indicators, and use this information to make faster decisions, correct issues, and identify growth opportunities.
How It Works
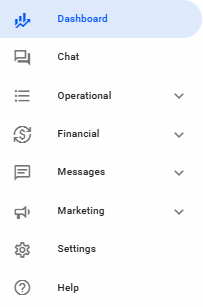
In your Reportana account, navigate to Dashboard in the side menu → Overview. Or access: Dashboard — Overview
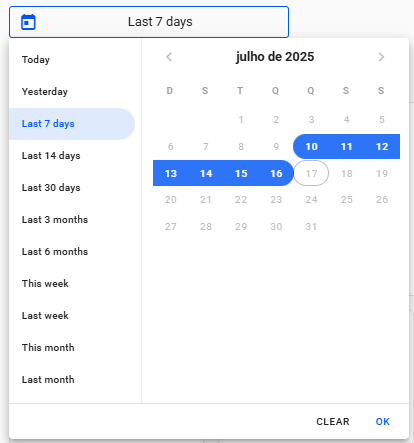
Apply the desired date range in the calendar to filter the data displayed on your Dashboard.
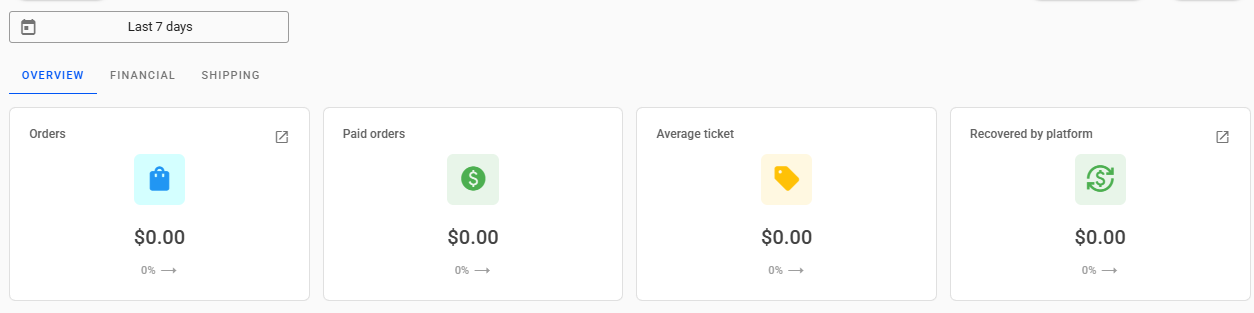
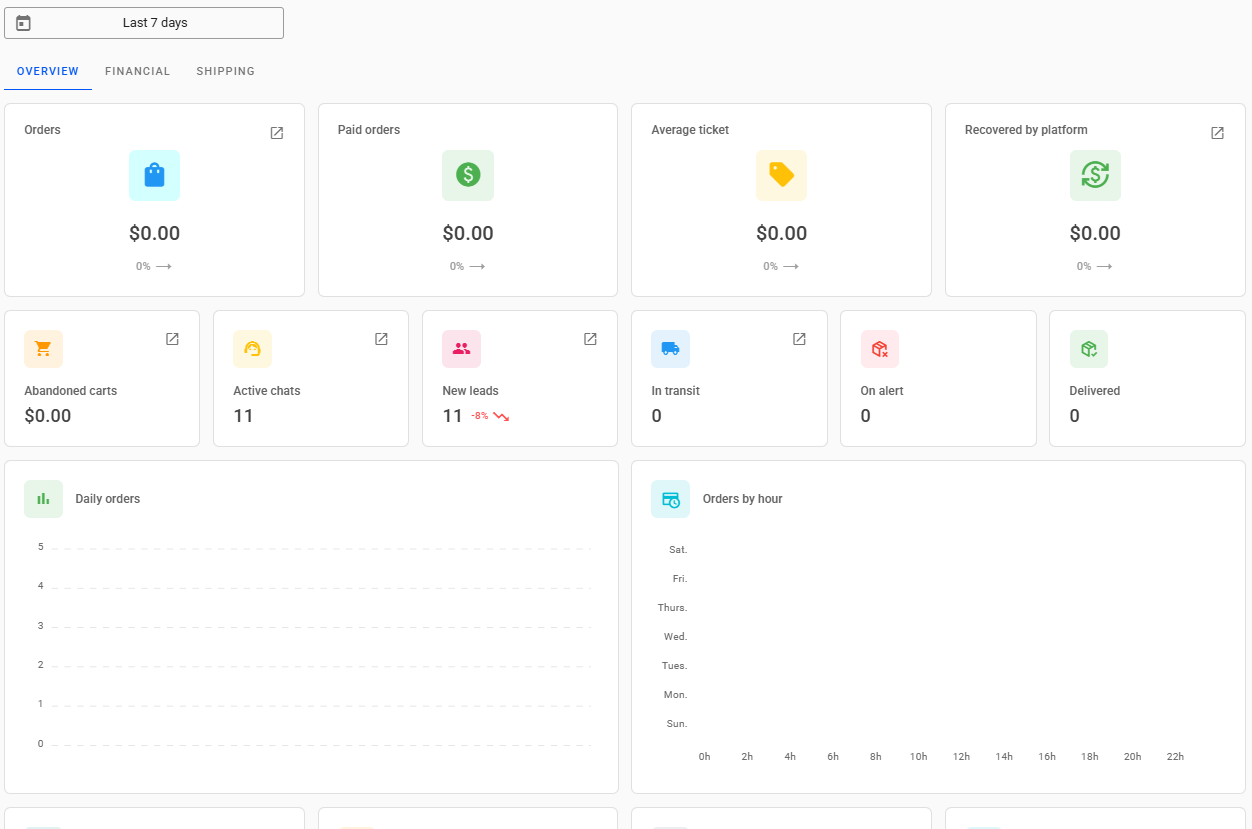
At the top of the Dashboard, with the selected date range applied, you can view the following key metrics:
- Orders: monetary value of all orders synchronized in Reportana within the filtered date range. This metric can be used to assess the total sales volume and understand the pace of order entry during the analyzed period.
- Approved Orders: monetary value of all paid orders synchronized in Reportana within the filtered date range. Measure conversion effectiveness and identify bottlenecks between placed and paid orders.
- Average Ticket: monetary value representing the average amount spent by customers during the filtered date range. Understand customer consumption behavior and identify opportunities to increase average purchase value.
- Recovered by the platform: monetary value of sales recoveries made by Reportana in the filtered date range, such as Abandoned Carts. Measure the direct impact of Reportana’s automations on revenue recovery and optimize your remarketing campaigns.
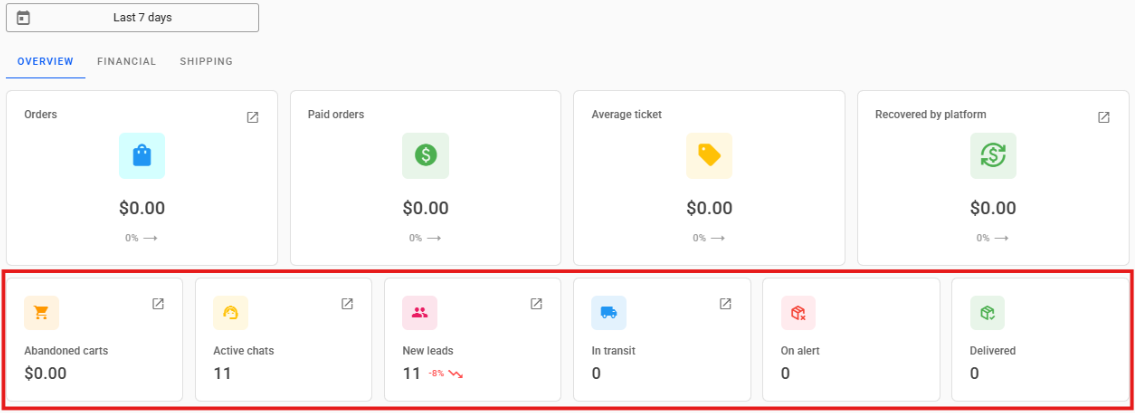
- Next, you will find metrics for Abandoned Carts, Active Chats, New Leads, and Tracking Metrics:
- Abandoned Carts: monetary value of all abandoned carts synchronized in Reportana within the filtered date range. Identify potential revenue losses and direct actions to increase the sales recovery rate.
- Active Chats: number of clients currently "In Attendance" in the chat on Reportana. Assess the current support demand and measure the real-time performance of the support team.
- New Leads: number of new leads synchronized in Reportana, which can come from orders, abandoned carts, chat clients, or uploaded via an external list. Monitor contact base growth and qualify the volume of new opportunities generated from different sources.
- In Transit: orders marked as "In Transit" in the Tracking Numbers tab on Reportana. Track the logistical status of shipments and anticipate possible delivery delays.
- On Alert: orders marked as "Customs" or "Taxed" in the Tracking Numbers tab on Reportana. Identify orders at risk of retention or taxation, enabling proactive communication with clients.
- Delivered: orders marked as "Delivered" in the Tracking Numbers tab on Reportana. Verify delivery success and measure the order completion rate in the analyzed period.
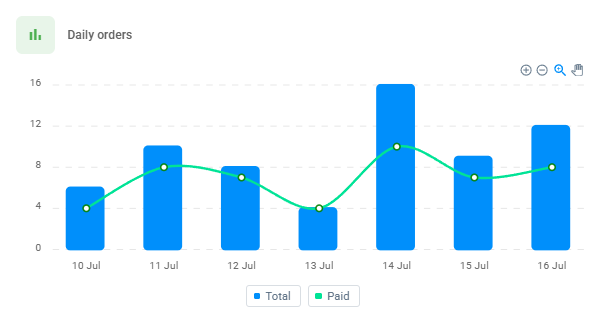
In the Daily Orders chart, we have the number of orders per day within the selected time frame in the filter. The green line crossing the chart shows how many of these orders were paid. Use this chart to identify peak or drop patterns in order generation and payment, and correlate with marketing actions, campaigns, or operational events. This enables immediate adjustments in commercial strategy to maximize conversions.
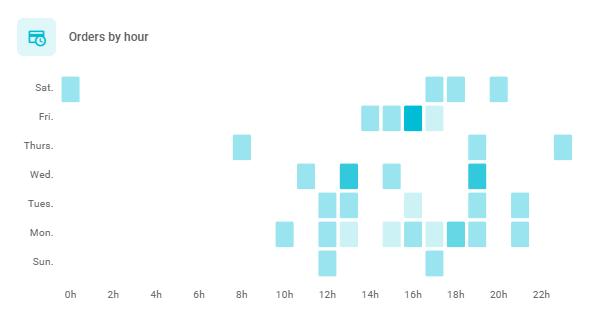
In the Orders by Hour chart, there is a heatmap of orders per hour within the selected time range in the filter. The more intense the blue color of a block in the chart, the more orders were placed at that hour. By hovering the cursor over a block, you can see the number of orders made during that one-hour interval. Use this chart to identify peak conversion hours and align campaigns, message sends, and support team availability with periods of higher traffic and purchase propensity.
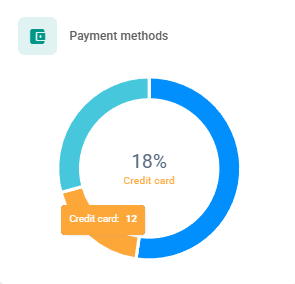
In the Payment Methods chart, the percentages represent the quantity of orders placed using each payment method, such as Pix, Boleto, and Credit Card. In addition to the percentage, hovering the cursor over a bar in the chart also displays the number of orders using that payment method within the selected time filter. This metric allows evaluating customer payment preferences, enabling strategic adjustments in checkout options, as well as identifying regional or seasonal behaviors that directly impact conversion.
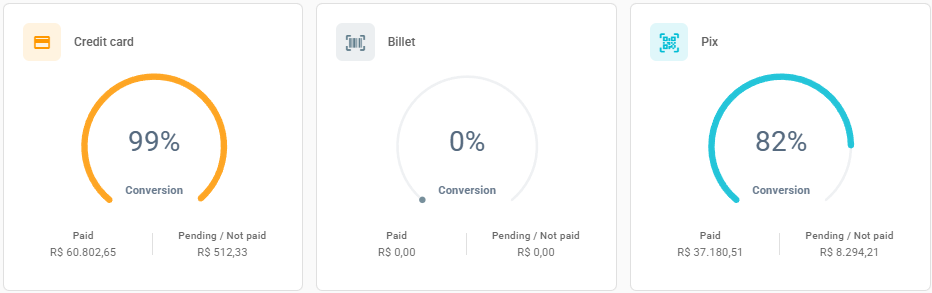
Following are the charts related to the conversion percentage of each payment method, accounting for the value of paid orders and the quantity of pending or unpaid orders. Below the chart, you can view the total monetary value of paid orders and pending or unpaid orders. This chart is essential to identify which methods have the highest effective conversion rate and which generate the largest volume of unfinished orders, enabling optimizations in the billing process, customer communication, or even the reassessment of less efficient methods.
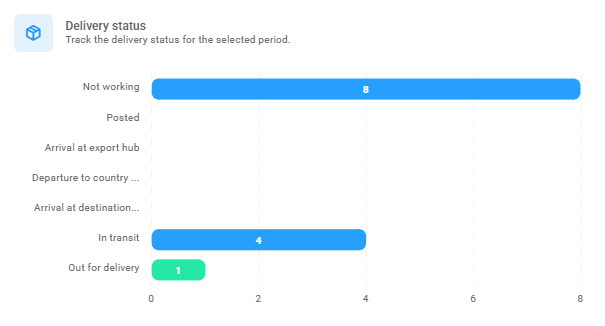
In the Delivery Status chart, you can view the distribution of tracking statuses for shipments. The bars in the chart show how many shipments currently have each status within the pre-selected period. This chart allows monitoring of the logistical progress of deliveries, identification of bottlenecks or operational delays, and proactive communication with customers to reduce dissatisfaction and support requests.
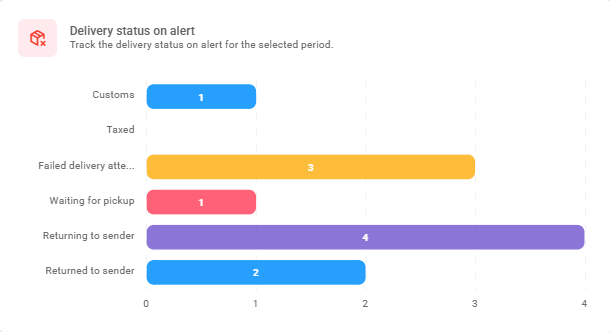
In the Delivery status on alert chart, you can view the distribution of the main alert statuses for shipments. Alert statuses include: Customs, Taxed, Failed Delivery Attempt, Waiting for Pickup, Returning to Sender, and Returned to Sender. Use this chart to identify failures or hold-ups in the delivery operation and trigger corrective actions with the carrier or customer service, minimizing impacts on the customer experience and potential revenue losses.
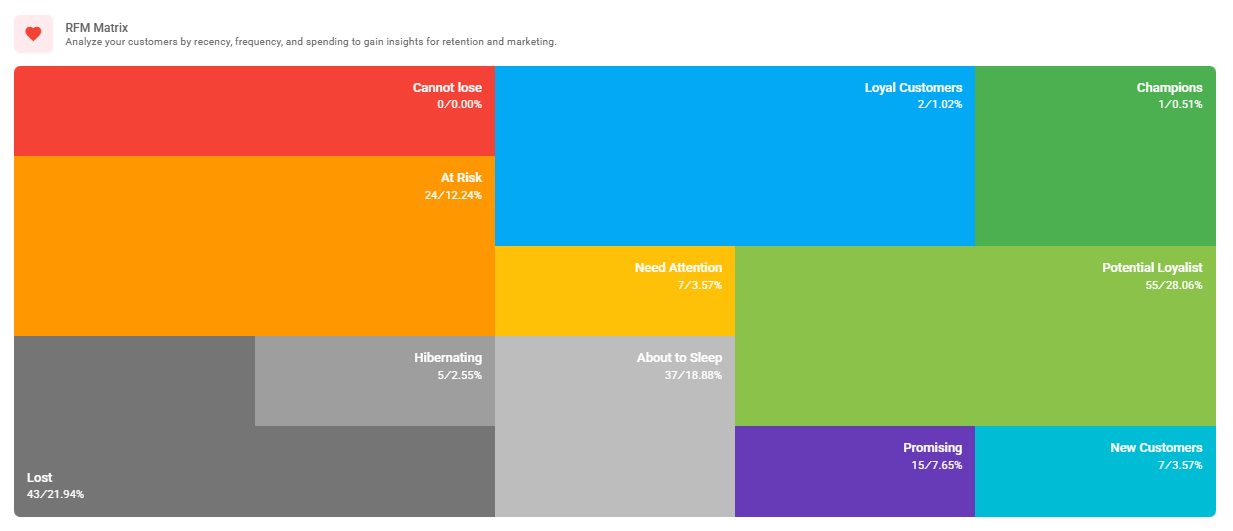
Finally, the RFM Matrix (Recency, Frequency, and Monetary Value) is a method of segmenting the customer base based on engagement. It is essential for gaining a better overview of your business in terms of sales, as it allows visualization of your customers' ordering cadence. The statuses can be interpreted as follows:
- Champions: customers who buy frequently, spend a lot, and have purchased recently — the best customers.
- Loyal Customers: buy frequently, but not always recently. Proven loyalty.
- Potential Loyal: customers with potential to become loyal — good frequency and average value.
- New Customers: customers who purchased recently but with low frequency so far.
- Promising: made few purchases but show signs of initial engagement.
- Needs Attention: customers with recent purchases but low value or frequency.
- About to Sleep: customers who used to buy well but have been inactive for some time.
- Hibernating: customers who haven't bought for a long time and have weak history.
- At Risk: good past customers who haven’t purchased for a while — risk of loss.
- Cannot Lose: valuable customers who stopped buying — must be urgently recovered.
- Lost: inactive and low-value customers — difficult to reactivate.
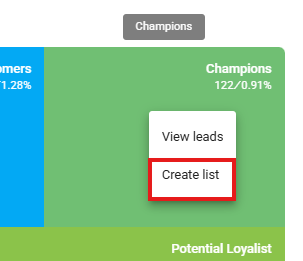
- It is also possible to create a lead list segmenting only the desired statuses from the RFM Matrix by simply clicking on the desired segment → Create list.